Resources available by radio:
1. Text reports – North Indian
Ocean
2. Text reports – South Indian Ocean
3. Weatherfax – South Indian Ocean
4. How to request a moving forecast GRIB
Resources available by internet:
5. Map of cyclone tracks for the 2011-2012 season
6. Metvue provides
1. North
24 & 48 hr. forecasts of wind speed & direction, weather, wave height, visibility, warnings for the 4 regions shown below. Report file size is ~ 5.5K
Source: Airmail – via Sailmail or Winlink

Areas of coverage:

Sub Regions:
A1
A2
A3
BAY OF
A4
BAY OF
2. South
24 & 48 hr. forecasts of wind speed & direction, weather, wave height, visibility, warnings for the 7 regions shown below. Includes coordinates of the ITCZ axis.
Report file size is ~6K
Source: Airmail – via Sailmail or Winlink

Areas of coverage:

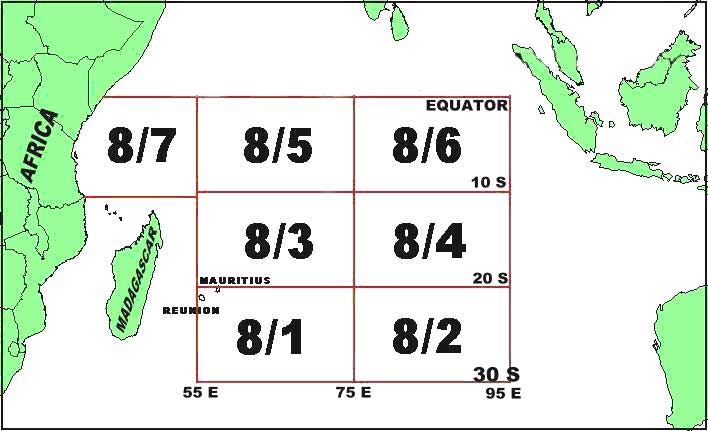
Sub Regions:
8/1
: 20 Degrees South to 30 Degrees South, 55 degrees East to 75
Degrees East,
8/2 : 20 Degrees South to 30 Degrees South, 75 degrees East to 95
Degrees East,
8/3 : 10 Degrees South to 20 Degrees South, 55 degrees East to 75
Degrees East,
8/4 : 10 Degrees South to 20 Degrees South, 75 degrees East to 95
Degrees East,
8/5 : 00 Degree South to 10 Degrees South, 55 degrees East to 75
Degrees East,
8/6 : 00 Degree South to 10 Degrees South, 75 degrees East to 95
Degrees East,
8/7 : 00 Degree South to 10 Degrees South, East African Coast
to 55 Degrees East.
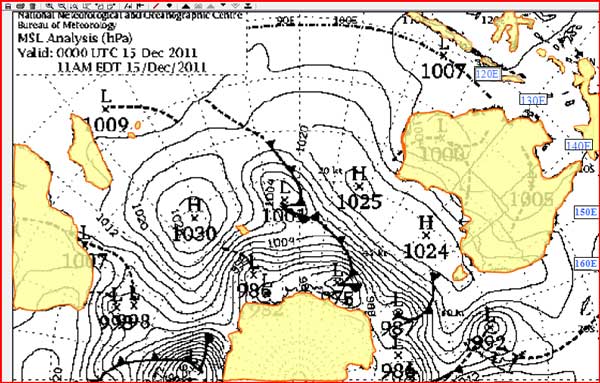
3. South
(0000 and 1200 UTC weather fax images)
Report file size is ~17K
Source: Airmail –via Winlink
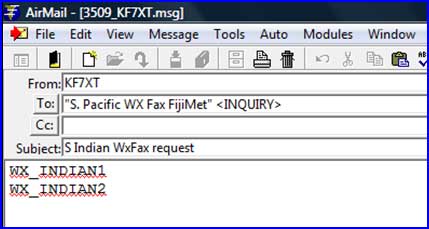
Coverage: see sample images below
0000 UTC 15 Dec. 2011 report

Same WxFax chart with outlined geography I added for clarity (for future reference)
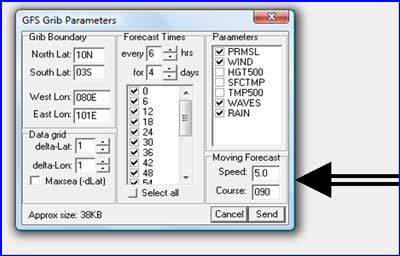
4.
GRIB Reports with moving forecast input
Source: Airmail – via Sailmail or Winlink
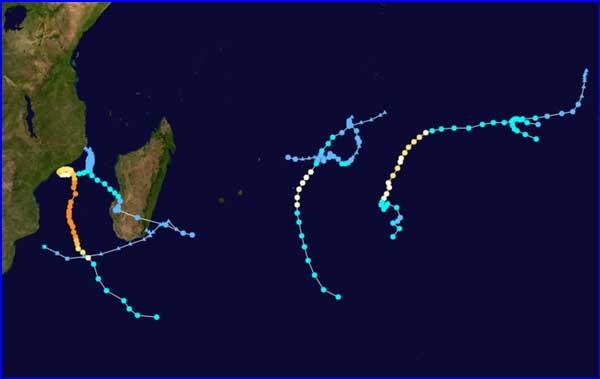
5. Southwest
Track maps, photos and descriptions of all
disturbances, depressions, storms and cyclones in the 2011–12 South-West
Indian Ocean cyclone season (7 as of Jan. 30, 2012). The points show the
location of the storm at 6-hour intervals. The colour represents the storm's maximum
sustained wind speeds as classified in the Saffir-Simpson Hurricane Scale. Detailed reports of the individual weather
systems are also available.
Source: Internet
http://en.wikipedia.org/wiki/2011%E2%80%9312_South-West_Indian_Ocean_cyclone_season
Coverage:
The basin is defined as the area west of 90°E
and south of the Equator in the Indian Ocean, which includes the waters around
30 Jan. 2012 summary report
6.
Metvuw
Click on forecast charts, then
Source: Internet: www.metvuw.com
Rev. Feb 26, 2012
Dave Pryde s/v Baraka